Shine a Light on Hidden Movements of Natural Investors
Observing large trades of institutional investors is invaluable. These natural investors include active managers and corporate insiders who trade stocks based on fundamental valuations. They also price in the impact of anticipated events and changes in macro conditions.
Alpha Cloning
Scouring SEC regulatory filings to glean “smart money” movements and sentiment is a common practice. Institutional investment managers must disclose their long positions, shares and market value, with quarterly Form 13F filings. Similarly, corporate insiders of publicly traded companies must report purchases and sales of equity securities using Form 4 – Statement of Changes in Beneficial Ownership. “Alpha-cloning” strategies attempt to mimic the returns of well-respected portfolio managers. Yet, there are two fundamental flaws with the input source when attempting to clone alpha:
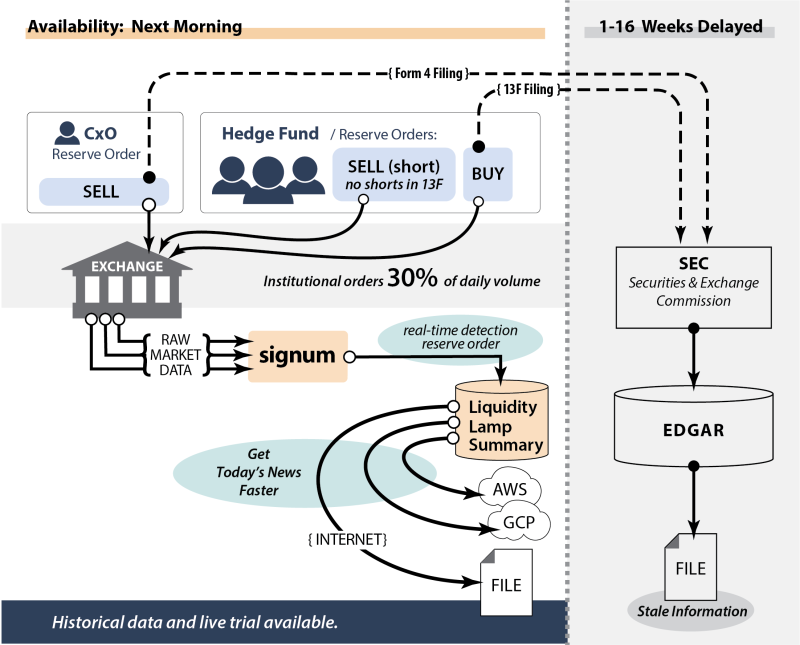
- The time lag of disclosure requirements is measured in days to months. Form 4 must be filed by corporate insiders two business days following the day of the transaction. Form 13F must be filed 45 days after the close of each quarter. The disclosed information is often stale and unactionable for near term alpha seekers. Furthermore, the value of 13F filings are also diluted by window dressing activities where portfolio managers alter their positions to frame their holdings ahead of disclosure filings.
- Short positions do not appear in Form 13F filings. Disclosure of long only views provide insufficient context for deciphering the true nature of each long position. A disclosed long position may be a hedge against a larger short position or one-leg of a pairs trade.
Identifying executions of large institutional orders faster is difficult – even though they represent 30% of daily volume. First, these investors use various techniques to minimize information leakage and market impact. Execution algorithms developed in-house or by brokers slice large “parent” orders, then schedule and route the “child” orders to various trading venues. Alternatively, many trading venues offer various hidden or “dark” order types that attempt to achieve the same goals. Pile on the rapidly changing bids and offers from electronic market makers and high-frequency traders and it becomes extremely difficult to pick up the “signal” from the noise.
Shining a Light on Hidden Orders
One of the most common types of hidden or “dark” order types provided by trading venues are reserve orders (i.e. “icebergs”). This order type exposes only a portion of the full size of an institutional order – typically one or two round lots to match the average transaction size on US equity exchanges. When the exposed portion is filled, the exchange automatically exposes the next portion as a new order. To achieve their stealthy goals these new orders may have a different order identifier and size than the previous portion.
Since natural investors often employ reserve orders to deftly move large volumes, they serve as useful proxy for the institutional position changes that are reported in Forms 4 and 13F. Signum’s Liquidity Lamp signal identifies and tracks the presence of reserve orders in real-time on US equities exchanges. As described in our Liquidity Lamp whitepaper
, this signal can be used in real-time to improve execution quality (e.g. by increasing order size when more liquidity is available) and to predict concentrations of trading activity.
Get Today’s News Today
In our conversations with diverse firms on the buy side, we have encountered many traders that see enormous value in Liquidity Lamp’s information but struggle to apply it to their trading strategies that have less turnover and longer hold times. This includes Alpha Cloning strategies, but also applies to firms looking for new sources of data for their proprietary models that predict asset price movements over periods of days or longer. In response, we developed a Signum data service that provides information at the end of each trading day.
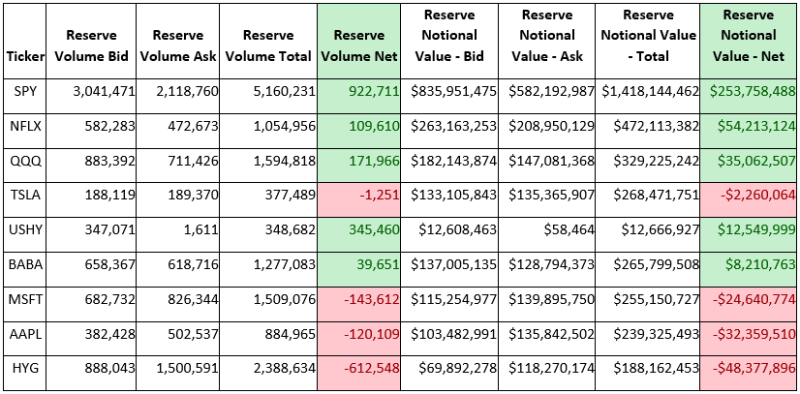
Liquidity Lamp Summary aggregates Liquidity Lamp signal data on a per symbol basis and delivers the information in a file after the conclusion of each trading session. Each file represents an end-of-day aggregation of natural investors’ buying and selling activities. For each listed security, it summarizes the trading activity using reserve order types:
- Volume – at bid, at ask, net (volume at bid – volume at ask), and total
- Notional Value – at bid, at ask, net (volume at bid – volume at ask), and total
- Volume Weighted Average Price – at bid, at ask, net (volume at bid – volume at ask), and total
The sample table of reserve order activity below provides real data as captured on April 21, 2020.
Example (subset of fields):
Actionable Information
A daily update of natural investor activities provides mid-frequency alpha seekers actionable fresh signals. The signals can be used to answer key questions
- Who’s Winning (buyer or sellers)?
- The net activity indicates the daily winning side. The color values in the sample table above indicates net buying (green) or net selling (red) with reserve orders.
- The magnitude of the net activity provides insight into the Street’s conviction and size. For example, a net notional value of $1 million has an impactful meaning when you know that there was $1.1 million of buying vs $0.1 million of selling activity. The buying side was 10x larger that the selling side.
- How are short-term and long-term trends changing?
- Trend of each symbol can be created by stringing days and weeks of data files together. The current day’s activity may signal the continuation or reversal of sentiment trends.
- Trend lines of net buying and selling can then be compared to index and benchmarks for similarities and predictive properties. Fund flows of reserve orders may provide indication of where investors are weighting their allocations. Changes to macro allocations may provide managers an early edge to identify changes in sector rotations.
Easy Evaluation, On Boarding, and Cancellation
Signum provides automated delivery of Liquidity Lamp Summary on a daily basis. Files can be “pulled” or “pushed” to your specified location in Amazon Web Services (AWS) or Google Cloud Platform (GCP), or via the Internet.
Signum provides complimentary evaluations for Liquidity Lamp Summary:
- Review demo data
- Read the Liquidity Lamp whitepaper
- Contact us to start a conversation about Liquidity Lamp summary
Want to know more? Learn how Signum’s Liquidity Lamp Summary data can be used to build alpha cloning strategies.