ETFs are Riding High: Can Firms Keep Up with Data Demands?
More than 25 years after their development, exchange-traded funds (ETFs) continue to be an increasingly important force to be reckoned with in the market. There are now more than 2,300 US-listed ETFs available, holding more than USD 5.4 trillion in AUM.
As institutional investors shift their assets from active management to index strategies, 78% name ETFs as their preferred means of index exposure, elbowing aside active mutual funds. The shift is understandable: ETFs offer a number of advantages, including lower costs, tax benefits, liquidity, and transparency.
They provide ways to pinpoint areas of interest—from geographic concentration to sector investing to thematic funds that track the effects of COVID-19 or the spending habits of millennials—while managing risk through diversification.
The diverse portfolios of ETFs and the ability to trade them like stocks yields attractive advantages that come with significant data challenges, including calculating the value of funds in real time. But firms can employ technology to overcome this challenge, using basket calculation engines to quickly compute the Net Asset Value (NAV) of an ETF based primarily on the current prices of its constituents and their relative weightings in the portfolio. This is the first in a multi-part series exploring the ways in which ETFs are changing global markets—and the data infrastructure needs of firms that participate in this vibrant marketplace.
How ETFs Work
Like the older, more established mutual funds, exchange-traded funds bundle a collection of securities, dividing that bundle into fractional shares and selling them. Using either type of fund, investors can diversify holdings more simply and inexpensively than by buying all the individual securities themselves.
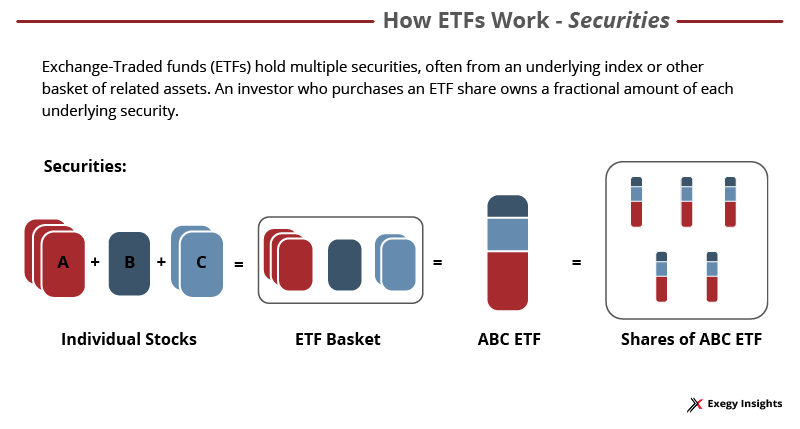
But ETFs carry significant advantages. Unlike mutual funds, shares of ETFs are traded on exchanges like individual securities, and like those securities, their price changes over the course of a trading session (mutual funds are bought and sold directly through their creator, at that day’s closing price).
This gives ETFs greater liquidity, and because ETFs can be made up of different asset classes, they can be a more accessible, less risky way to trade illiquid assets such as real estate investment trusts (REITs) and Bitcoin. In general, ETFs disclose their holdings daily, compared with mutual funds’ quarterly disclosures. This increased transparency can also represent less risk for a variety of investors.
The demand for ETF data—including the sizes and fees for so-called creation units (large blocks of new ETF shares) and the number and weighting of constituent shares—has led to a boom in the number of firms specializing in ETF reference data.
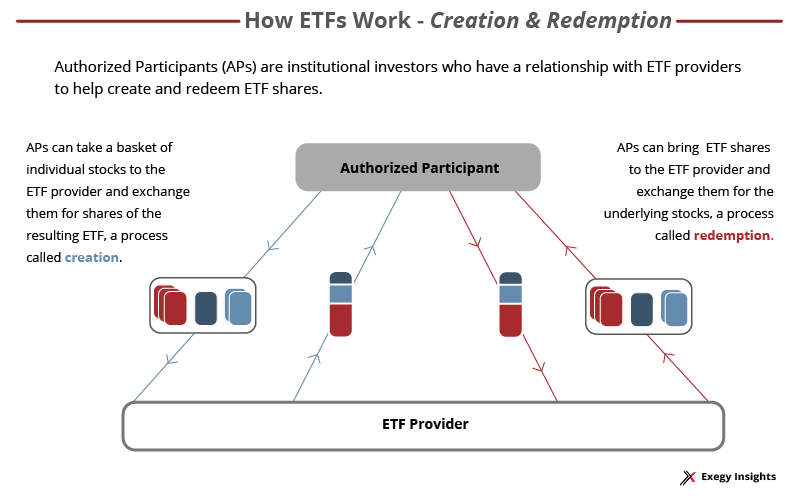
ETFs also confer certain tax advantages, particularly to those who participate in the creation and redemption of ETF shares, a group of institutional investors known as “authorized participants (APs).”
An AP puts together a basket of individual securities and gives it to the ETF provider, resulting in the creation of a share that is passed back to the AP. An AP who wants to redeem a share gives it to the ETF provider, in exchange for the individual securities.
Because these transactions don’t involve cash, there is no capital gains tax, providing yet another reason for firms acting as APs—usually large investment banks—to employ ETFs in their strategies. Learn more about this tax advantage and how it plays into firms’ strategies in this post.
Types of ETFs
An ETF provider can create a fund from any type of asset, weighting the portfolio’s constituents in any way they wish. The most popular asset class after equities is bond ETFs.
Most early exchange-traded funds were set up as passive index followers, and the largest ETFs by market capitalization are those that track popular benchmarks—out of the top five, three are based on the S&P 500, one on the Nasdaq and another tracks a total market index.
Table 1. Largest Exchange-Traded Funds by market capitalization (Dec. 2020)
| Ranking | Largest ETFs | Benchmark index | AUM (USD million) |
| 1 | SPDR S&P 500 ETF (SPY) | S&P 500 | 325.5 |
| 2 | iShares Core S&P 500 ETF (IVV) | S&P 500 | 237.9 |
| 3 | Vanguard Total Stock Market ETF (VTI) | CRSP US Total Market | 192.1 |
| 4 | Vanguard S&P 500 ETF (VOO) | S&P 500 | 172.2 |
| 5 | Invesco QQQ (QQQ) | Nasdaq | 147.6 |
These broad-based funds are set up to be inexpensive to maintain—in fact, as the push to drive down costs has intensified, fund companies have even set up less expensive versions of their own index funds.
In recent years, competition from ETFs has helped drive down fees for mutual funds, particularly passively managed index funds. In fact, in 2019, the average asset-weighted expense ratio for equity index mutual funds was .07%, compared to .18% for equity index ETFs. This is in part because of the much larger mutual funds’ economies of scale; experts believe that as the ETF market matures, that expense ratio gap will narrow. Despite the higher fees, many investors are still drawn to the real-time pricing and liquidity offered by index ETFs.
Broad-based index tracking isn’t the only use for ETFs. They can track smaller segments of the market, including market sectors, specific industries, geographic regions, and niche interests.
Geographic ETFs are a good way to gain exposure in countries or regions that are difficult for foreign investors to enter. Market sector, industry, and thematic ETFs allow firms to manage the risks and to outsource the initial research involved in entering new sectors to ETF providers.
A good illustration of the breadth of available ETFs is ETF.com’s list of the fastest-growing funds for 2020. This list is based on percentage increase, so it includes many newer, smaller funds whose growth can range from 700-8,000%. The list contains three industry funds (airline manufacturing, video games/esports, and cloud computing); multiple asset-class funds; a geographic fund focused on developed markets; and one devoted to companies that meet environmental, social, and governance (ESG) requirements.
The list also includes buffered ETFs, which offer protection against downturns in exchange for caps on gains, highlighting the use of ETFs in portfolio risk management.
Another fast-growing ETF sector includes leveraged and inverse funds. The popularity of these funds, which offer investors simplified access to derivatives, has led federal regulators to warn against their use by retail investors, particularly in volatile markets. 2020 saw the sudden closure of more than three dozen leveraged and inverse exchange-traded products as a result of COVID-induced volatility.
While passive funds continue to be the most popular, a 2020 survey of global investors underscores the growing interest in actively managed ETFs and in so-called smart beta ETFs, which combine aspects of both active and passive funds. Investors reported directing about 69% of their portfolios to passive ETFs, with plans to decrease that share to about 61% over the next 2-3 years. Passive funds are less expensive to operate, but active and smart beta ETFs aim to outperform them.
Creation/Redemption and Basket Calculation
There are two main markets for exchange-traded funds. The secondary market consists of the trading of existing ETF shares through brokers, exchanges, or other equity trading venues; it’s the principal way that retail investors use ETFs.
The primary market involves the creation and redemption of ETF shares by institutional investors acting as authorized participants.
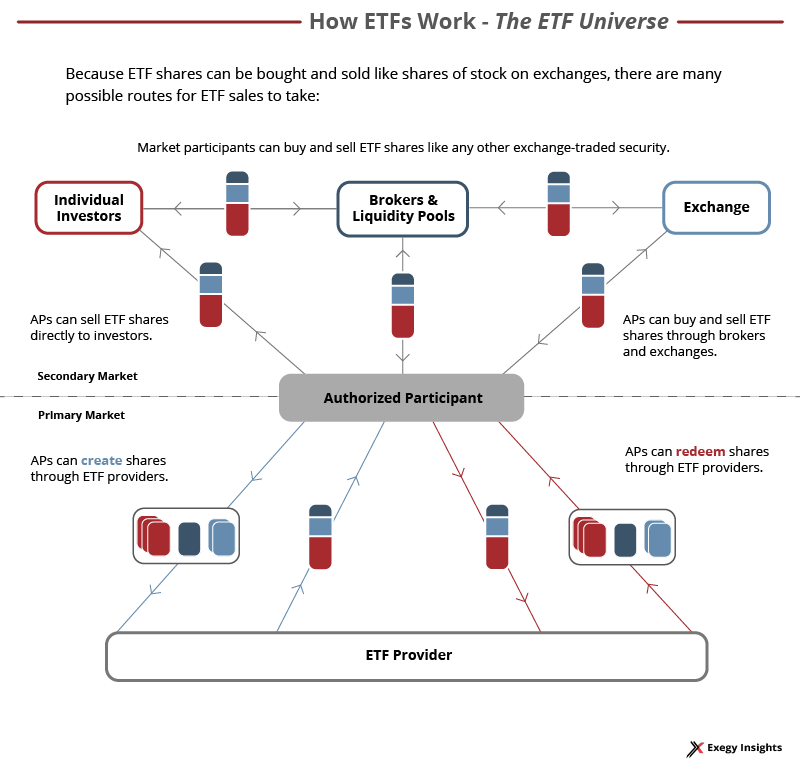
APs benefit from creation/redemption in two ways; by selling shares they create to their customers and through leveraging the difference between the price of an ETF share and the Net Asset Value (NAV) of its constituent securities. Learn more about how creation/redemption is the magic behind ETF liquidity and efficiency here.
Making shrewd creation/redemption decisions requires the ability to calculate the difference between an ETF share price and its net asset value in real time—no small task when funds contain hundreds of securities and the price of each security may change hundreds or thousands of times per second.
That’s where basket calculation engines come in. For large-scale ETF trading strategies, the amount of computing power and software that must be developed, deployed, and maintained can be enormous and expensive. Exegy’s Ticker Plant uses Field-Programmable Gate Array (FPGA) technology to perform this speed-critical calculation far more quickly and efficiently in purpose-build hardware. It calculates the net asset value on every bid, offer, and trade price update of the constituent securities for each user-defined basket or ETF.
New NAVs can be calculated in a few hundred nanoseconds (billionths of a second), allowing firms to make immediate creation/redemption decisions. It’s an especially useful feature during times of volatility when fast-moving markets can cause the net asset value to change hundreds or thousands of times more frequently than the price changes of the constituent securities.
Throughout this series, we’ll explain how Exegy’s basket calculator can aid in a variety of ETF trading strategies, including market making and ETF/index arbitrage, and how firms can leverage these abilities to optimize tax strategies.
If your firm is ready to talk more about incorporating this technology into your ETF strategies, contact us.
