US Elections Could Spur More Demands on Infrastructure
The extreme market volatility experienced during the early days of the coronavirus pandemic was a warning flag for market participants of a continued bumpy ride ahead. The upcoming US elections could be the next big test of firms’ market data and trading infrastructure.
So far this year, spikes in market volatility have been accompanied by surges in market data feed rates. At MarketDataPeaks (MDP), Exegy and the Financial Information Forum (FIF) together provide real-time feed rates for US equities and derivatives to help financial services firms plan for the necessary infrastructure to keep up with data flow.
MDP’s data shows that since March 2020’s market roller-coaster ride, there have been continual periods of acceleration of the feed rates for the Securities Information Processor (SIP) feeds for US equities and options markets. This group includes the mammoth Options Price Reporting Authority (OPRA) feed, which always produces a higher volume of data than equities SIP feeds.
New records have been set for the per-second rate of both messages and packets moving through market data infrastructure, as well as for microbursts—millisecond-long periods of intense data flow.
Responding to this increased data flow, many firms have been assessing their systems, to ensure they can handle the increased rates. But as rates continue to climb, specs that may have passed muster in the spring could potentially be strained again by a new round of volatility related to next week’s US elections or to potential adverse COVID-19 developments. Firms can survive and even thrive in this fast-paced, uncertain environment. But it requires an understanding of how volatility affects market data as well as constant vigilance to ensure mission-critical systems are up to the challenge.
An Uncertain Election Outcome
According to FiveThirtyEight, a statistical analysis website that tracks election polling, on Oct. 29, Democrat Joe Biden had an 89 in 100 chance of defeating Republican President Donald Trump. RealClearPolitics, a non-partisan political news site and polling data aggregator, also favors Biden. Predictions of who will carry the two houses of Congress are more varied. An analysis by US Bank of the potential presidential, House, and Senate outcomes found that two were most likely to be associated with short-term volatility: A sweep by either the Democrats or the Republicans of the presidency and both houses of Congress.
But who wins is not the only factor in election uncertainty—another is the potential for a delayed decision.
Because of the record number of mail-in ballots cast in this election, there is a strong possibility that final results will not be available on election night. In several key swing states (including Pennsylvania, North Carolina, Ohio, and Nevada), ballots arriving after Nov. 3 can still be counted. In Ohio, mailed ballots postmarked by Nov. 2 can arrive as late as Nov. 13 and still be eligible.
Members of the Electoral College don’t cast their official ballots until Dec. 14—and that doesn’t take into account any potential legal challenges similar to those that affected the 2000 US presidential election.
Weeks of doubt as to the direction of the country, potentially combined with continued COVID fears, could shake up the markets yet again. A September 2020 CNBC survey of investors and strategists found that a third expected to see volatility in the fourth quarter of the year. Twelve percent cited election uncertainty as their biggest fear; 60% cited a possible new wave of COVID.
Volatility Revs Up Market Data Rates
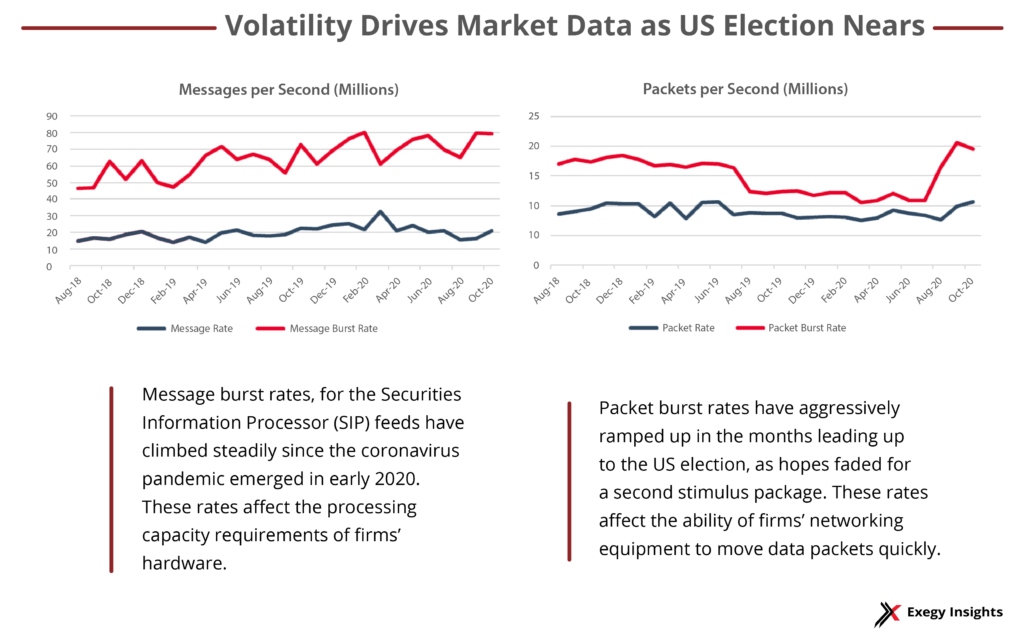
Thanks to MarketDataPeaks, we have some idea of what the impact of that volatility could be on firms’ infrastructure. On Feb. 26, as word spread of a dangerous novel coronavirus reaching pandemic status, the SIPs’ message burst rate hit a historic peak of 80.4 million messages, 74% higher than the rate on Feb. 26, 2019. On March 18, as schools and businesses across the country announced closures, the SIP feeds’ message rate peaked at 32.5 million messages per second—179% higher than the rate the year before.
Increased message rates affect hardware needs, requiring increased processing capacity for ticker plants and feed handlers.
Packet rates affect the ability of networks to move data packets via switches and interface cards. Here, too, the SIP feeds set records: On Sept. 11, the packet burst rate peaked at 20.6 million packets, or 78% higher than the same day in 2019, and on Oct. 1, the packet rate hit its historic peak of 10.6 million packets, a 29% increase over the previous year.
Table 1. Historic peaks for SIP feeds of US equities and derivatives. Source: MarketDataPeaks
| Data Rate Record | Msgs/Pkts per sec* | Date | In the News | Increase over 2019 rate |
| Message Burst Rate | 80.4 million | 02/26/2020 | CDC says COVID-19 is headed toward pandemic status. | 74% |
| Message Rate | 32.5 million | 03/18/2020 | Schools and businesses across the US announce closures. | 179% |
| Packet Burst Rate | 20.6 million | 09/11/2020 | Health experts warn of a deadly winter ahead. | 78% |
| Packet Rate | 10.6 million | 10/01/2020 | White House staffer Hope Hicks reported to have COVID-19 | 29% |
Preparing for Volatility with Resilience
While market data rates can tell us where we’ve been during this unprecedented year, the clearest picture of the road ahead may be Cboe’s Volatility Index, which measures implied volatility based on options positions on the S&P 500 index 30 days ahead. The index, which started 2020 at a tame 12.47, peaked on March 16, closing at 82.69, and hit a post-February low of 21.35 on Aug. 17.
As of Oct. 29, the volatility index stood at 37.59. Currently, index futures prices for the period leading up to the Dec. 14 Electoral College vote are in the 30s, and they remain elevated for expiration dates throughout the first quarter of 2021.
So how should market participants respond to the possibility of continued volatility and its effect on market data rates?
First, even firms that took steps earlier this year to ensure the resilience of their market data infrastructure may have to revisit their calculations as data rates continue to accelerate. There is some evidence that participants are doing this already. Traditionally firms look to set systems capacity at 2x normal daily trading volume, but in a recent FIF survey of broker-dealers, 25% believe it may be necessary to upgrade their systems to 3x volume or more.
As we noted in March, not only did market data rates increase sharply at that time, the consistency of high rates was unusual. Instead of following “normal” patterns in which peak rates cluster around the beginning and ending of the trading session, data rates remained high—meaning that firms’ trading infrastructure was operating at maximum capacity for the majority of the trading session. Exegy’s line of high-capacity market data appliances kept pace without faltering.
In anticipation of another potential surge in market data rates, Exegy has provided quantitative assurance to our customers that our appliances have more than sufficient capacity. Using its high-precision hardware replay engine, Exegy demonstrated to customers that latency performance was impacted by less than 15% when market date rates increase by a factor of three. Furthermore, Exegy appliances experienced no data loss at replay rates of 12 times the recorded rate.
In addition to providing flawless real-time market data, our Exegy Capture Replay (XCR) appliances help firms store high-precision recordings of these historic market events to make them available for playback, analysis, and application testing. Available as an on-premises appliance, hosted service in the data center or public cloud, the XCR is a robust historical market data solution at an affordable entry point.
Second, our research also tracked a spike in the number of changes to NBBOs in the US national market system during March 2020. While a typical trading day sees about 2 billion of these changes, high-volatility days in mid-March logged more than 4.5 billion NBBO changes. Twice as many of these quote changes were so-called “short fuse” changes, meaning they expired in 50 milliseconds or less.
They represented opportunities to leverage predictive signals such as Quote Fuse, an offering in Exegy’s Signum suite that predicts NBBO price stability.
Like our real-time market data solutions, Signum’s algorithms were able to keep pace with the increased rate of changes, and in fact, Quote Fuse’s accuracy improved slightly as volatility increased.
Potential election-related volatility isn’t simply a challenge to be overcome—it can open a window of opportunity for firms who understand its impact. Exegy has spent the past eight months learning from the historic market events of 2020. We can provide insight to your firm as you plan for the uncertain weeks and months ahead.
